The birthday problem — Part 2: The statistical shortcut
In this post, we will answer a question that we previously failed at:
What is the probability that two students in a classroom share the same birthday?
This is described as a paradox because for a classroom of realistic size, the probability is surprisingly higher than intuitively expected.
Previously, we could only solve this for very small classrooms of 2 or 3 students. The reason? Too much data.
We will now get around this obstacle by the means of random sampling.
Precision vs efficiency
Our previous approach was designed for absolute precision. Unnecessary precision, in fact. The counting method, as described below, needs amounts of data that make any PC just give up:
-
For a given classroom size, reproduce all possible combinations of birthdays (amount: n).
-
Check each combination and count the ones with at least one common birthday (amount: ncommon birthday).
-
The probability is the percentage:
\(P_{common~birthday} = \frac{n_{common~birthday}}{n}\)
This method didn’t scale well with increasing classroom size. The required data increased exponentially, one of the worst ways to scale.
With just 4 students we needed to reproduce 3654 ≈ 17.7 billion combinations of 4 students each — at which point, we just got an error message.
| Classroom size | Total combinations (n) | Reproducible | Combinations with common birthday (ncommon birthday) | Probability of common birthday (Pcommon birthday) |
|---|---|---|---|---|
| 2 students | 3652 ≈ 133 k |

|
365 | $\frac{365}{365^2}=$ $0.27\%$ |
| 3 students | 3653 ≈ 48.6 Μ |
|
398 945 | $\frac{398~945}{365^3}=$ $0.82\%$ |
| 4 students | 3654 ≈ 17.7 Β |

|
? | $\frac{?}{365^4}=$ $~~~~?~\%$ |
| ... | ... |
|
... | ... |
For more realistic classrooms of, say, 25 students we’d need 36525 combinations of 25 students each, a number that I don’t even dare calculate.
As a result, we cannot know this probability for classrooms with more than 2 or 3 students.
Figure 1: Probability that a classroom has at least one common birthday. Only showing known probabilities for 2- and 3-student classrooms.
Strategy
To get around this for up to 50 students, we’ll sacrifice precision for efficiency: instead of reproducing all possible combinations, we’ll reproduce and analyze a much smaller random sample of them and get an approximate solution. Let’s go for 2 000 classrooms for each size.
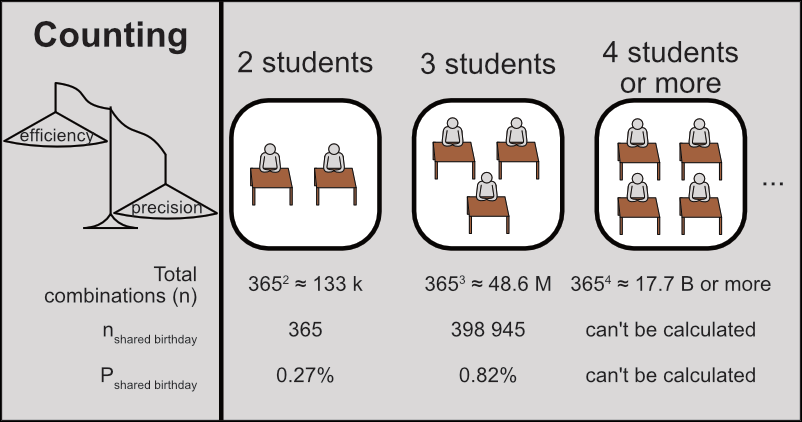
Figure 2: Strategy to find approximate solutions by random sampling.
Let’s start by defining these parameters:
max.classroom.size <- 50
sample.classrooms <- 2000
Code explanation
We assign the following parameters as variables:
-
max.classroom.size(50 students): the maximum classroom size (the minimum will be of course 2 students). -
sample.classrooms(2 000 random classrooms): the number of random classrooms to recreate for each size.
Create data
We can now start creating our data. The code below recreates 2 000 classrooms of each size, ranging from 2 to 50 students.
library(data.table)

classroom.birthdays.sample <- 2:max.classroom.size |>

  lapply(FUN = function(classroom.size,sample.classrooms) {
    temp.data <- CJ(classroom.size = classroom.size,
                    classroom.index = 1:sample.classrooms,
                    student.index = 1:classroom.size)
    return(temp.data)
    }, sample.classrooms = sample.classrooms) |>

  rbindlist()
Code explanation
Our starting point is the sequence [2, 3,…, 50] (2:max.classroom.size), in other words all the classroom sizes we want to work with.
This sequence is passed to lapply with the pipe operator (|>). lapply creates a data table with 2 000 classrooms for each size, based on a custom function (see more details below).
The resulting data tables for different sizes are passed to rbindlist, which binds them together into one table for further analysis.
Details on the custom function FUN, which recreates classrooms of a specified size.
-
It takes 2 arguments as input:
-
The 1st argument
classroom.sizerepresents each element of2:max.classroom.sizeinside the function. It changes between iterations, starting from 2 up to 50. -
The 2nd argument
sample.classroomshas one constant value (2 000). It is defined after the curly brackets and does not change between iterations.
-
-
The data for each classroom size is constructed as
temp.data:-
CJproduces a cross-join table of given vectors, i.e. a data table with all combinations of each vector value (see Cross-join for more information). In this case, we produce a cross-join of 3 vectors:-
classroom.index: sequence [1, 2, …, 2 000] (see Sequences) -
student.index: sequence [1, 2, …,classroom.size] -
classroom.size: self-explanatory, 1 value in each iteration ofFUN. It has just 1 value, so it creates a column without affecting the number of rows in the table.
-
-
-
The resulting
temp.datafor each classroom size is returned as a result with thereturncommand.
In the table we just created, each row represents a single student (student.index) who belongs to a specific classroom (classroom.index) of specific size (classroom.size).
Let’s take a look at the table:
classroom.birthdays.sample
##          classroom.size classroom.index student.index
##       1:              2               1             1
##       2:              2               1             2
##       3:              2               2             1
##       4:              2               2             2
##       5:              2               3             1
##      ---
## 2547996:             50            2000            46
## 2547997:             50            2000            47
## 2547998:             50            2000            48
## 2547999:             50            2000            49
## 2548000:             50            2000            50
Next, we’re going to create a new column with a random birthday for each student.
set.seed(seed=1)

classroom.birthdays.sample[
  ,birthday:=sample(x=seq(from=as.Date("2025-01-01"),
                          to=as.Date("2025-12-31"),
                          by=1),
                    size=.N,replace=TRUE)]

classroom.birthdays.sample
##          classroom.size classroom.index student.index   birthday
##       1:              2               1             1 2025-11-20
##       2:              2               1             2 2025-06-16
##       3:              2               2             1 2025-05-09
##       4:              2               2             2 2025-10-26
##       5:              2               3             1 2025-09-27
##      ---
## 2547996:             50            2000            46 2025-03-02
## 2547997:             50            2000            47 2025-02-05
## 2547998:             50            2000            48 2025-02-08
## 2547999:             50            2000            49 2025-09-18
## 2548000:             50            2000            50 2025-07-01
Code explanation
-
The
set.seedfunction is usually run in the beginning of any experiment with random data, to ensure reproducibility. See Random samples for more information. -
The first argument inside a
data.table’s brackets determines which rows to handle. If left blank (as in this case), all rows are handled. See Row operations for more information. -
We use the
:=assignment operator to create a new column on ourdata.table. See Column operations for more information. -
The
samplefunction draws random elements from a specified set. See Random samples for general information. This is how we use it in this case:-
x: The source of random values - in this case aDatevector with all days in the year 2025 (first to last day of the year incremented by 1, see Sequences for more information). -
size: The number of drawn random values, in this case.N..Nis a special symbol in the context ofdata.table, which gives the number of rows. In this case, it gives all the rows of thedata.table. -
replace: determines if the random sample drawing is done with replacement. In this case, it only makes sense to draw with replacement. See Random samples for more information.
-
Analyze data
We now have all the data we need. All we have to do is look at it.
The code below creates a new data table common.classroom.birthdays from the original one.
In the new table, each row will represent a whole classroom. Each classroom will be marked for the occurrence of common birthdays: TRUE if a common birthday occurs, FALSE if it doesn’t.
common.classroom.birthdays <-
  classroom.birthdays.sample[
    ,.(common.birthday = (length(unique(birthday)) < classroom.size)),
    by=.(classroom.size,classroom.index)]

common.classroom.birthdays
##        classroom.size classroom.index common.birthday
##     1:              2               1           FALSE
##     2:              2               2           FALSE
##     3:              2               3           FALSE
##     4:              2               4           FALSE
##     5:              2               5           FALSE
##    ---
## 97996:             50            1996            TRUE
## 97997:             50            1997            TRUE
## 97998:             50            1998            TRUE
## 97999:             50            1999            TRUE
## 98000:             50            2000            TRUE
Code explanation
We create and display an aggregate table, which groups students together by classroom and checks if common birthdays exist. This new table has the field common.birthday, with the value TRUE if a common birthday exists, or FALSE if not.
-
The grouping together of students is set with the
byargument. Each classroom has a unique combination ofclassroom.sizeandclassroom.index. Therefore grouping by both separates the students by classroom. -
The assessment of each classroom is done with the logical expression
length(unique(birthday)) < classroom.size:FALSE->length(unique(birthday)) == classroom.size-> all birthdays are unique -> No common birthdays.TRUE->length(unique(birthday)) < classroom.size-> unique birthdays are fewer than the classroom size -> At least one common birthday.
The new table has a field named common.birthday, which takes values TRUE or FALSE. Each classroom is marked based on the condition we set (length(unique(birthday)) < classroom.size).
Finally, the code below counts the classrooms of interest (ncommon birthday) for each classroom size and calculates their percentage (frequency) within that size.
common.classroom.birthdays.counted <-
  common.classroom.birthdays[
    ,.(common.birthdays.freq = sum(common.birthday==TRUE)/.N),
    by=classroom.size]
Code explanation
We count all classrooms where a common birthday occurs (sum(common.birthday==TRUE)) and divide them by the total number of classrooms (.N).
The resulting aggregate table is given the name common.classroom.birthdays.counted.
-
We create a field called
common.birthdays.freq. This field sums all classrooms where a common birthday occurs (common.birthday==TRUE) and divides the sum by the total number of classrooms (.N). -
In this case, the
byargument groups the data by classroom size (by=classroom.size). This way, we calculate the frequency of common birthdays (common.birthdays.freq) for each classroom size.
Let’s see how the results look:
Figure 3: Frequency of classrooms where there is at least one common birthday. Dashed horizontal line: 50%.
Some observations:
-
The main result is obvious: just 23 students are more likely to have a common birthday than not to have one (over 50% probability). This goes even higher for larger classrooms.
-
The results for 2- and 3-student classrooms are not exactly the same as found previously, exactly because we sacrificed precision for efficiency. So the resulting frequencies are approximations of the true probabilities.
-
For the same reason, the results are a bit “noisy”: there is a trend, but it’s not perfectly smooth.
Any common birthday vs same as my birthday
I think the reason this is considered a paradox is that most people interpret the question as a different one:
What is the probability that a classmate has the same birthday as me?
The classrooms that satisfy this condition also satisfy the original condition — but not the other way around. In other words, this is a more specific condition. Because of this, the probability is indeed quite lower.
So let’s actually see how it looks like in our data set: we can simply take student #1 as a reference and check for any other students with matching birthdays.
The code below examines each random classroom and creates a column with TRUE or FALSE values for this specific condition.
common.classroom.birthdays.specific <-
  classroom.birthdays.sample[
    ,.(common.birthday.specific = (birthday[1] %in% birthday[-1])),
    by=.(classroom.size,classroom.index)]

common.classroom.birthdays.specific
##        classroom.size classroom.index common.birthday.specific
##     1:              2               1                    FALSE
##     2:              2               2                    FALSE
##     3:              2               3                    FALSE
##     4:              2               4                    FALSE
##     5:              2               5                    FALSE
##    ---
## 97996:             50            1996                    FALSE
## 97997:             50            1997                     TRUE
## 97998:             50            1998                    FALSE
## 97999:             50            1999                    FALSE
## 98000:             50            2000                    FALSE
Code explanation
We create and display an aggregate table, much like common.classroom.birthdays, but with a different condition, birthday[1] %in% birthday[-1] (see Vectors for more information):
-
FALSE->!(birthday[1] %in% birthday[-1])-> no other student has the same birthday as student #1. -
TRUE->birthday[1] %in% birthday[-1]-> there is a matching birthday with that of student #1.
The new table has a new field named common.birthday.specific, which takes values TRUE or FALSE. Each classroom is now marked based on the condition we set (birthday[1] %in% birthday[-1]).
To compare with the previous condition, we can bring all data together in one place. The piece of code below brings the new column to the original common.classroom.birthdays table.
As we now have data on both conditions, we can calculate the frequency of classrooms where each condition occurs (TRUE):
common.classroom.birthdays.specific.counted <-
  common.classroom.birthdays.specific[
    ,.(common.birthday.specific.freq=sum(common.birthday.specific)/.N),
    by=classroom.size]

common.classroom.birthdays.specific.counted
##     classroom.size common.birthday.specific.freq
##  1:              2                        0.0045
##  2:              3                        0.0025
##  3:              4                        0.0050
##  4:              5                        0.0155
##  5:              6                        0.0170
## ---
## 45:             46                        0.1200
## 46:             47                        0.1175
## 47:             48                        0.1165
## 48:             49                        0.1355
## 49:             50                        0.1175
Code explanation
The code is virtually identical with a previous code snippet — except it creates the field common.birthday.specific.freq, which calculates the frequency of classrooms that satisfy the more specific condition.
As expected, the more specific condition “common birthday with me” indeed seems to have lower probability than the original condition, especially for larger classrooms.
Let’s get a wider overview of how it compares to the original condition:
Figure 4: Frequency of classrooms where there is at least one common birthday between any students (grey) vs with a specific student (green). Dashed horizontal line: 50%.
Some conclusions:
-
For the smallest possible classroom (2 students) the two frequencies are exactly the same.
This is not a statistical “accident”. If there are only 2 students (#1 and #2), then the common birthday is by definition between these 2 students. Therefore, both frequencies have the same starting point.
-
After that starting point, the increase of each frequency is very different:
-
The condition “any common birthday” seems to increase rapidly until it reaches a plateau.
-
The condition “same birthday as me” seems to increase with a more steady pace.
The reason has to do with the underlying math, which is perhaps a story for another time…
-
Getting to know your algorithms
Let’s zoom out a bit. When I stumbled upon this problem, I wondered in just how many ways I can approach it. The ways I can think of boil down to three algorithms:
-
Counting or brute force (failed): lay down and analyze all possible combinations.
-
Sampling (worked): draw and analyze a small random sample of all possible combinations.
-
Math: find the function that gives the true probability for each classroom size,
\(P_{common~birthday}=f(classroom~size).\)Barely qualifies as an algorithm. It’s mostly mental effort, and then just one calculation based on one number.
Computational complexity is “the amount of resources required to run [an algorithm]”, commonly referring to time and data (Wikipedia).
A key difference between these algorithms is in their data requirements, or space complexity, and how they increase in relation to the input (classroom size).
| Method: | Counting | Sampling | Math |
|---|---|---|---|
| Aims for: | Precise probabilities | Approximate probabilities | Precise probabilities |
| Data required: | classroom size · 365classroom size | classroom size · 2 000 | 1 number (the classroom size itself) |
| Space complexity: | Exponential | Linear | Constant |
We could say that the space complexity shows the personality of each algorithm — something to keep in mind when choosing how to solve a problem:
-
The counting method is strong but naive, thinking that brute force alone will achieve anything. In this case it failed because of its exponential space complexity, but for other problems it might work.
-
The sampling method is a pragmatist, accepting limitations and getting to a solution, even if it’s not perfect. In this case it reduced space complexity to linear — sacrificing some precision, but it showed the pattern and that’s good enough.
-
And the mathematical method is the smartest of the bunch, getting to the precise solution with no physical effort at all. But maybe we can’t spare the mental effort (at least for now…)
Session info
## R version 4.6.0 (2026-04-24 ucrt)
## Platform: x86_64-w64-mingw32/x64
## Running under: Windows 11 x64 (build 26200)
##
## Matrix products: default
##   LAPACK version 3.12.1
##
## locale:
## [1] LC_COLLATE=English_United States.utf8
## [2] LC_CTYPE=English_United States.utf8
## [3] LC_MONETARY=English_United States.utf8
## [4] LC_NUMERIC=C
## [5] LC_TIME=English_United States.utf8
##
## time zone: Europe/Stockholm
## tzcode source: internal
##
## attached base packages:
## [1] stats     graphics  grDevices utils     datasets  methods   base
##
## other attached packages:
## [1] plotly_4.12.0       scales_1.4.0        ggthemes_5.2.0
## [4] ggplot2_4.0.3       data.table_1.18.2.1 blogdown_1.23
##
## loaded via a namespace (and not attached):
##  [1] gtable_0.3.6       jsonlite_2.0.0     dplyr_1.2.1        compiler_4.6.0
##  [5] tidyselect_1.2.1   stringr_1.6.0      tidyr_1.3.2        jquerylib_0.1.4
##  [9] yaml_2.3.12        fastmap_1.2.0      R6_2.6.1           labeling_0.4.3
## [13] generics_0.1.4     knitr_1.51         htmlwidgets_1.6.4  tibble_3.3.1
## [17] bookdown_0.46      bslib_0.10.0       pillar_1.11.1      RColorBrewer_1.1-3
## [21] rlang_1.2.0        cachem_1.1.0       stringi_1.8.7      xfun_0.57
## [25] sass_0.4.10        S7_0.2.2           lazyeval_0.2.3     otel_0.2.0
## [29] viridisLite_0.4.3  cli_3.6.6          withr_3.0.2        magrittr_2.0.5
## [33] crosstalk_1.2.2    digest_0.6.39      grid_4.6.0         rstudioapi_0.18.0
## [37] lifecycle_1.0.5    vctrs_0.7.3        evaluate_1.0.5     glue_1.8.1
## [41] farver_2.1.2       httr_1.4.8         rmarkdown_2.31     purrr_1.2.2
## [45] tools_4.6.0        pkgconfig_2.0.3    htmltools_0.5.9